Fronius Solarweb App - consumer training
TRAINING OVERVIEW
This article covers education on the following topics:
- Why is solar monitoring important
- Understanding the solarweb pro apps
- Solarweb Pro - without a smart meter
- Solarweb Pro - without a smart meter
- Consumption monitoring guidance
WHY IS SOLAR MONITORING IMPORTANT?
All Fronius inverters have WiFi monitoring available. The most common reason for this not being connected is due to home network modems being more than 10m away, weak modem strength or use of a 3G/4G modem as opposed to land line modems. If you are having problems with WiFi connection - please see our article on WiFi connection resolutions.
Solar monitoring provides a few money saving benefits.
1. If your solar system shuts down or faults, you can receive early warning emails to ensure you don't have weeks or months of no solar production
2. If you do receive a fault notification, and you have shared your solar monitoring with GI Energy we can quickly diagnose the issue remotely. Sometimes this means an instant fix. Because we are not sending our electricians out to every fault report, our response times are improved when we do need to send someone out.
3. When you can view your energy consumption patterns, you have an opportunity to maximise your solar savings by changing your usage habits.
UNDERSTANDING THE SOLARWEB PRO APP
Please note: If you have downloaded the solarweb 'Live' app, please delete it and download the Solarweb 'Pro' app. The pro app provides considerably better information.
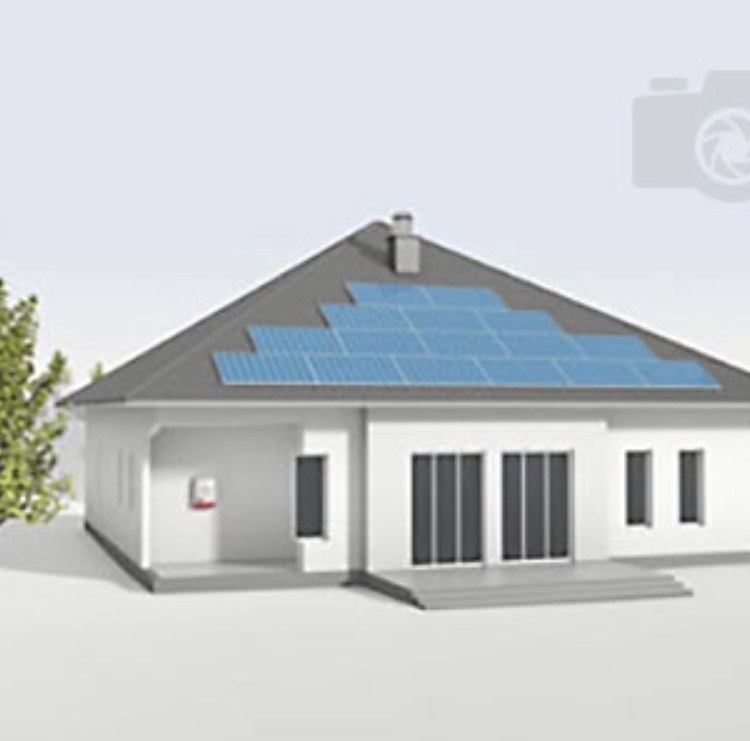
If you are logged in correctly, you should see either a photo of your solar panels or a drawing of a house. Below this you should see 5 circles and below that a '7 day overview' chart. Then you'll see some overview figures below that.
The photo.
This can be updated by logging into www.solarweb.com - going to 'Settings' (found on the bar along the top of the screen), then to 'image'.
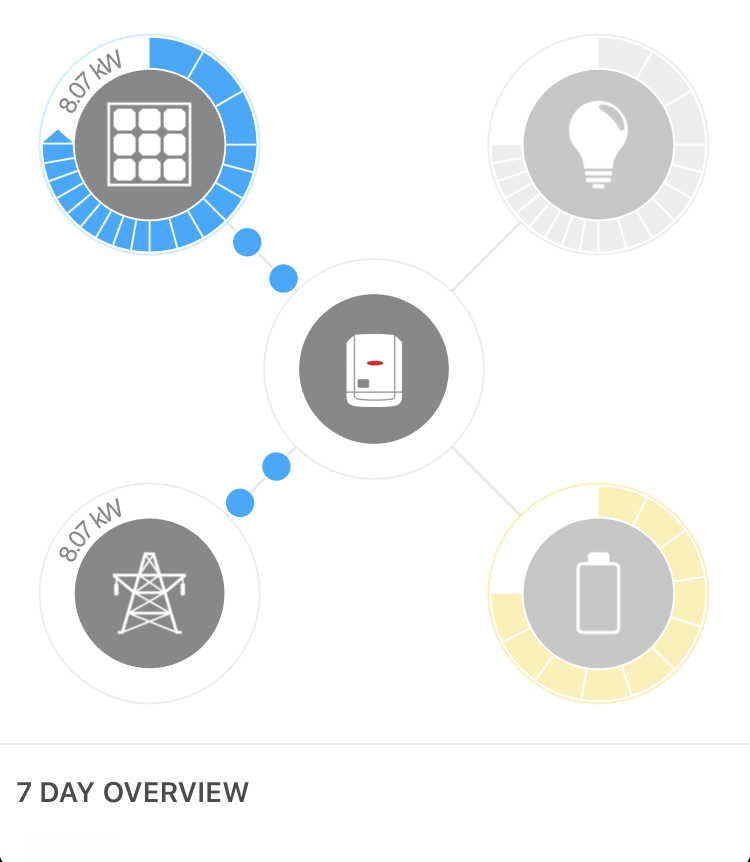
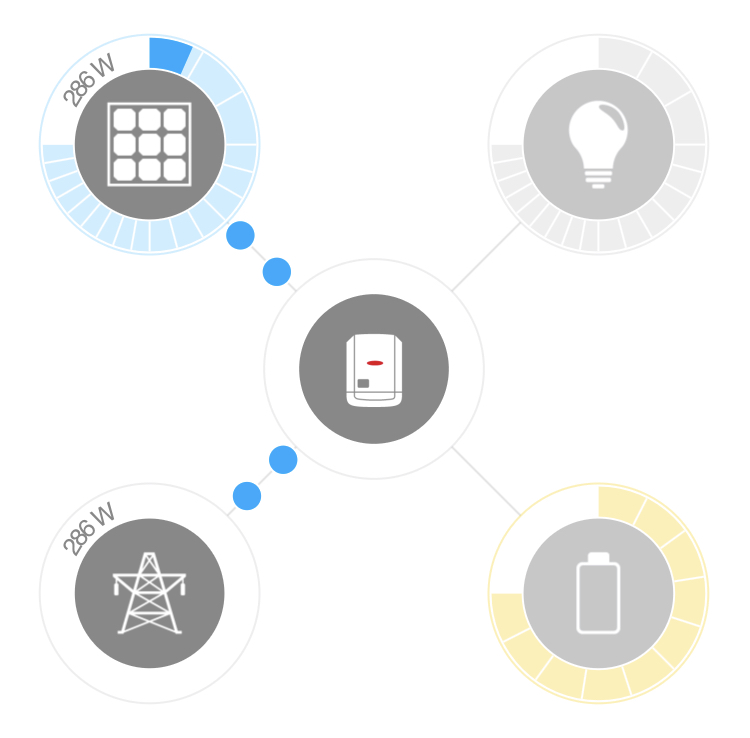
5 Circles
What you will be able to see here will depend on how your solar monitoring is setup. If you have included a Fronius Smart meter in your purchase you will be able to see how much energy you are consuming. If you don't have a smart meter, you will only see solar generation.
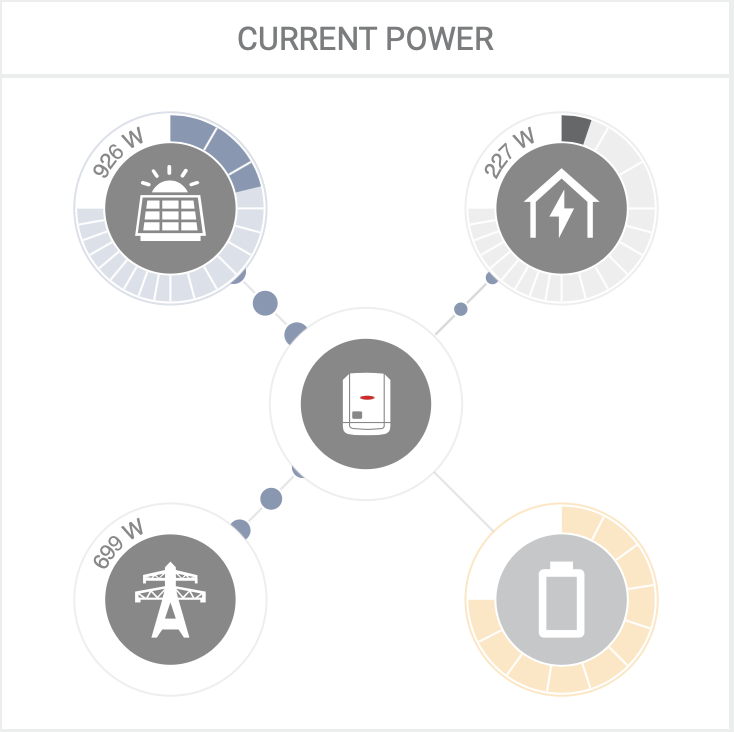
Circle 1 (top left 'panels') - this shows you exactly what the solar panels are producing.
Circle 2 (top right 'light globe') - this shows you what your home is consuming (5 min interval reporting)
Circle 3 (Center - 'solar inverter) - this is your solar inverter. It's job is to manage the flow of electricity between your panels, your home, the grid and if you have one - a battery.
Circle 4 (bottom left - 'the grid') - this shows you the energy being sent (sold) to the grid.
Circle 5 (bottom right - 'battery') - if you have a battery installed, this will show charge or discharge of the battery.
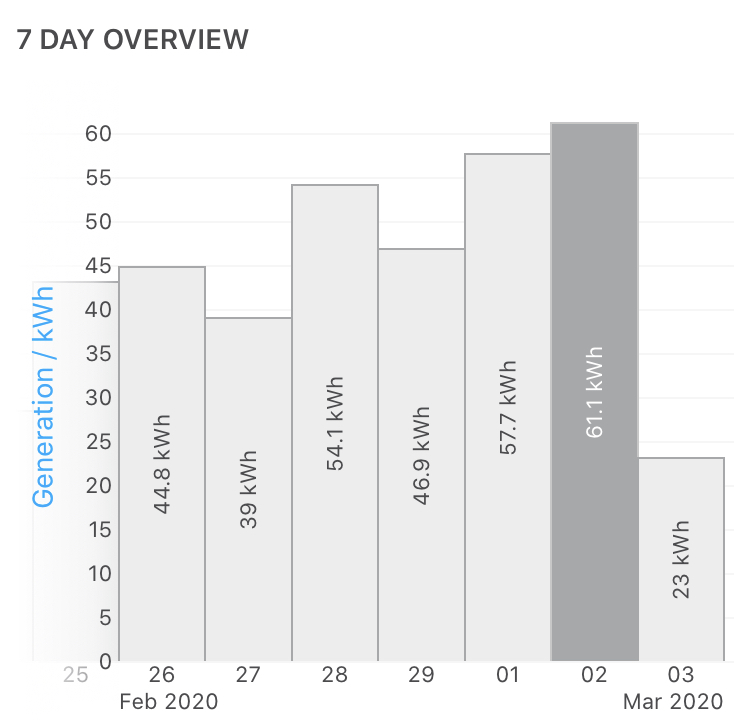
7 day overview
This obviously displays a quick 7 day overview of your solar production. If you click on this chart, you can go into a more dynamic reporting tool.
Turn your phone to the side from 'portrait' to 'landscape' view. you will see the chart update.
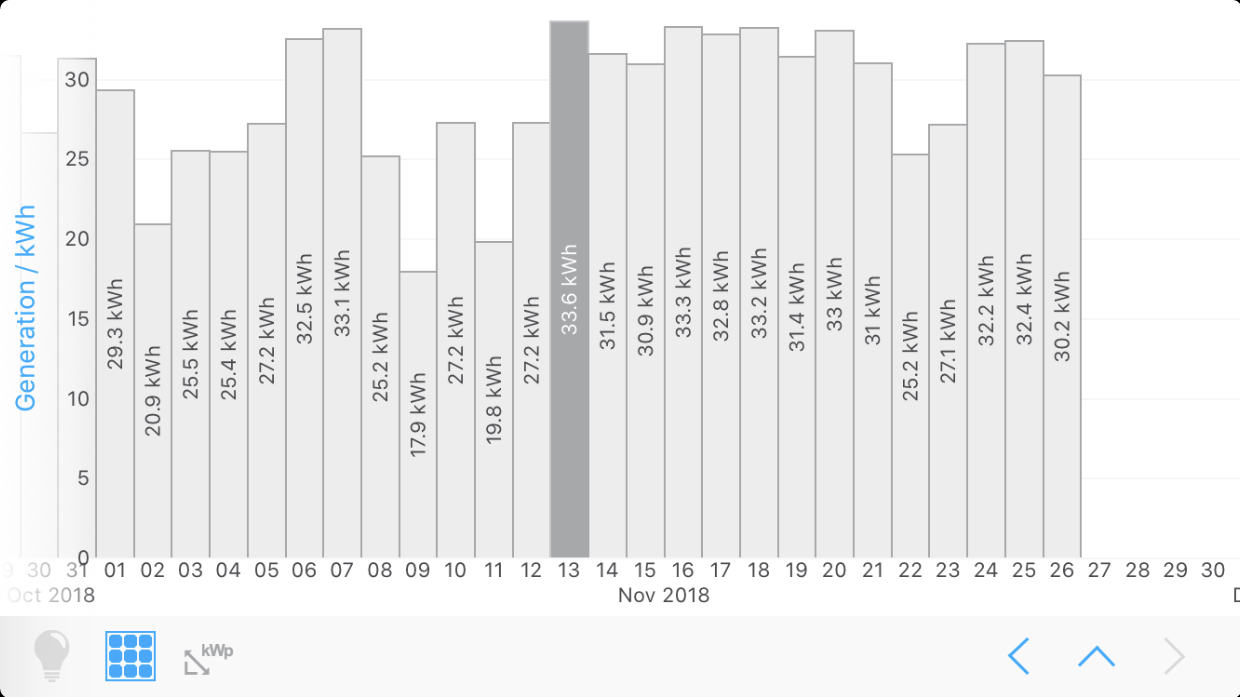
Use two fingers to pinch or push to see more of the daily chart or to 'zoom out' and see several days at a time. If you continue to zoom out, the graphs will become bar columns. You can continue to zoom out and see a whole month of daily bar columns, then continue to zoom out to see monthly, then yearly bar columns.
Expert tip:
If your solar monitoring has been operational for several years, compare December and January of each year. Zoom into each month and look for the highest performing day over these months. If your first December shows days with 33kWh as the best day, you can consider this a reference day. If you find that you are having similar 'best days' in the Dec/Jan of following years, you can assume your system is working well. If you find that there is a 5% drop in best days, it would be safe to assume your panels require maintenance and a clean. This method is a good indicator or the health of your solar system. Please do not try and compare December and January with any other months. This is when the sun has the strongest output for solar panels.
Other reporting
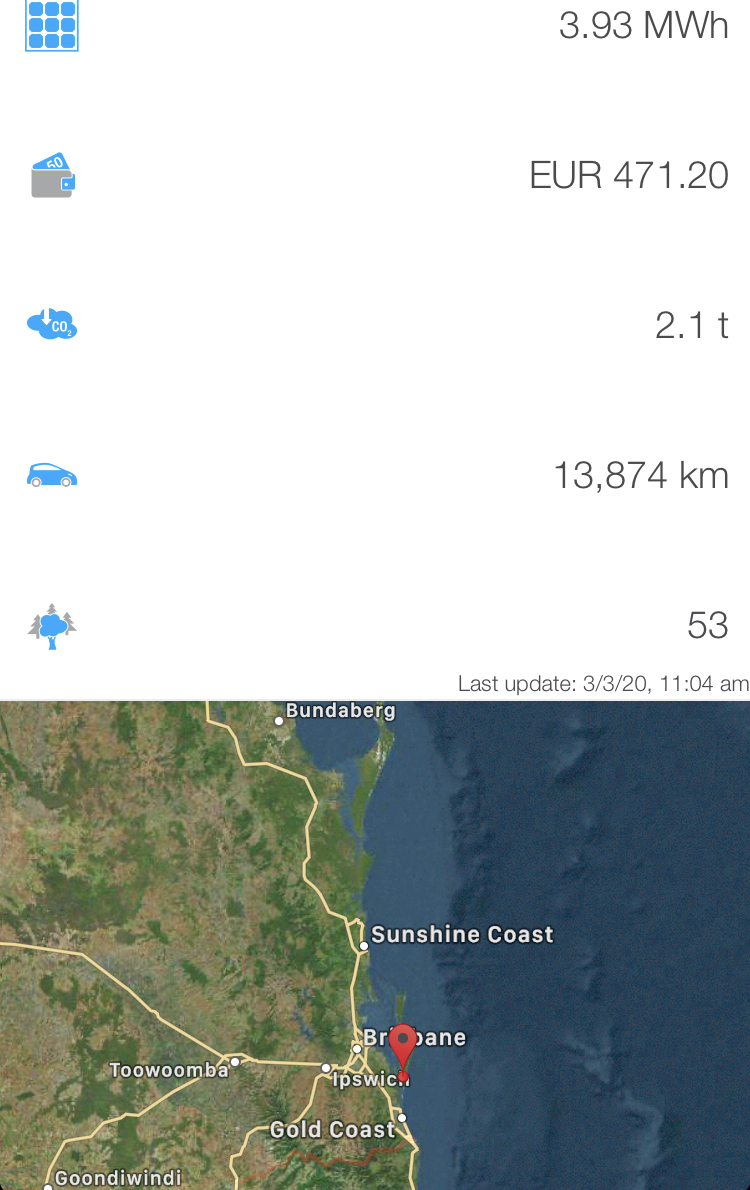
The solarweb app also displays other information regarding total system production, savings estimates and carbon benefits. There is also a map with the system location added.
Please note that the savings estimates are only accurate if a smart meter has been installed and both the feed in and consumption tariff information is up to date.
What is a smart meter
A smart meter is a seperate device from the solar inverter. It is installed into the main meter box and is used to meter energy consumption. The benefit of tracking energy consumption is to assist you in modifying your energy consumption patterns to maximise the amount of free solar energy you use.
SOLARWEB PRO - WITHOUT A SMART METER
If you do not have a Fronius smart meter installed, this display will appear to tell you that 100% of your solar energy is being fed back to the grid. This is not correct. It is not ideal to see reporting in this way, however because the system does not see how your solar energy is divided between self use and feed-in, it can only report in one way.
If you are prepared to do a little reporting when your energy bill comes in, you will be able to work out what percentage of your solar consumption is being used and what is being fed to the grid.
Doing the math manually involves a few steps:
1. Check your energy bill period (start and stop dates)
2. Check how many KiloWatt Hours have been fed back to the grid (found in the solar breakdown on page 2 or 3)
3. Calculating the solar generation between the billing start/stop dates. This can be a slow task as you'll need to check the full months + each day before/after full months to calculate the total solar generation.
Once you have this information, you can copy the following example by replacing the numbers with your own.
Start/Stop dates 2 Dec - 3 Feb (91 Days)
Solar Feed-in 500kWh
Solar production 2000kWh
Therefore, solar production was utilised this way:
25% feed-in
75% self consumption
You will also note the 7 day overview screens will only show solar production.
SOLARWEB - WITH A SMART METER
When a solar meter is installed, your solarweb app can show you exactly what your energy movement is doing. For example in the picture below, the panels are producing 926 Watts, the home is using 227 Watts and 699 Watts are being sold to the grid.
You will notice that after dark, there is no solar production and 100% of the home use is coming from the grid. At other times during the day, the home could be drawing energy from both the solar system and the grid.
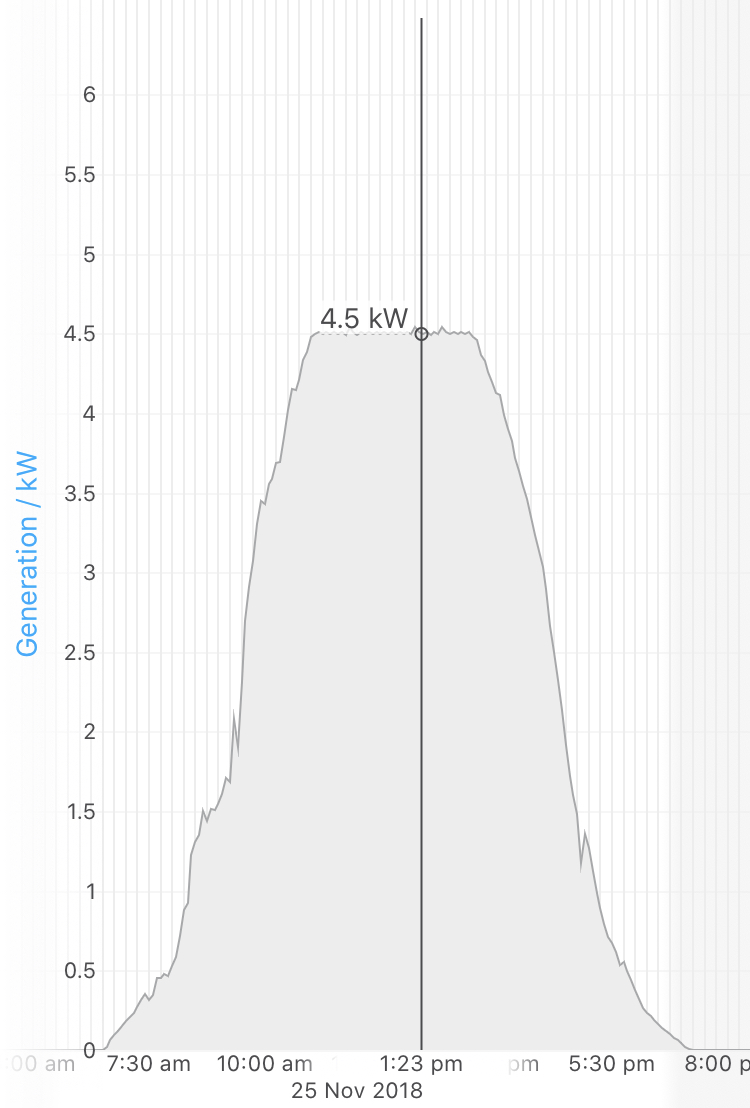
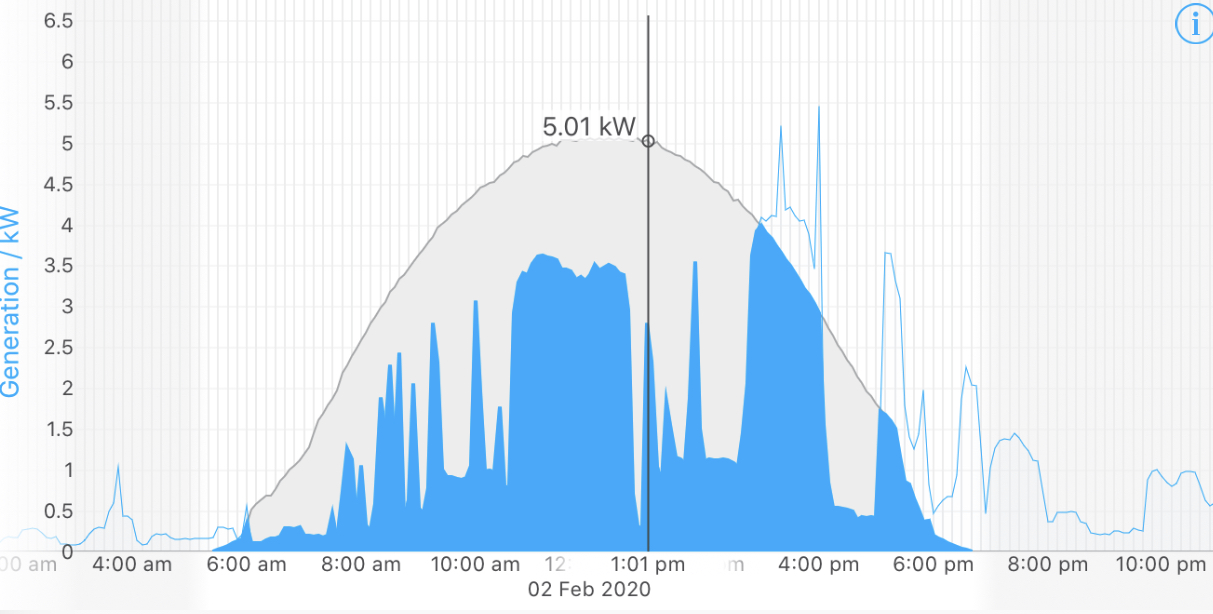
The 7 day overview reporting shows much greater detail.
Key:
Along the left, you will see a rising number. This is the kWh (KiloWatt Hour) measurement. If you have a 5kW inverter, it will show up to 5kW of solar production depending upon your energy suppliers approved limit (as an example, your supplier may limit your feed-in to 4.6kW so they can effectively manage the grid)
Along the bottom, you'll see a time scale from morning to evening. Note that the background at night is shaded.
Grey area - solar production - in this chart, the grey area is the solar production. Please note that this appears to start at 6am and stops around 6pm. You will find it helpful to observe when solar production passes 1kW in the morning and the evening. Between these times is the best time to use your electric appliances. You will also need to check this in December and June as the sun rises and sets later in winter - which means a shorter solar production period throughout the day.
Blue line - You will notice the blue line before 6am and after 6pm. It can also be observed in the peak at 4pm. This blue line indicates you are using energy that is being purchased from the grid.
Blue shaded area - The blue shaded area indicates the solar energy that you are consuming. In this example, the homeowner has done a great job of minimising energy consumption before 6am and has kept most of his daily use within solar production. It is very typical to see spikes in energy consumption between 6pm and 8pm. This is when most people come home, cook dinner and catch up on hobbies etc.
Grey area - feed in. now that you can identify the solar energy production and what you are using you can observe the solar production that is not self consumed. This is therefore being sold back to the grid.
CONSUMPTION MONITORING GUIDANCE
If you don't have the Fronius smart meter installed, your energy provider may have an app that provides this information. Please contact them to find out if it is available for your home.
Taking time to observe your energy use patterns will help you make informed choices about how you take advantage of solar for maximum results. It can also help you understand potentially wasteful energy consumption habits.
The Fronius monitoring is updated approx every 5 minutes. There is a slight delay between what the app is reporting and what the solar inverter reports, however you can rely on your app data.
You can use the self consumption monitor to 'test' your appliances. For example, you could turn as much as you can off and observe your 'base load'. This is the energy you use when you are either asleep or out for the day. From this point, you can turn on appliances and see what their energy consumption looks like. Try testing water pumps, dish washers, air con etc (one by one). By obtaining this information, you can begin to make informed choices on when you use your appliances.
If you notice a regular spike of energy each day, take note of when it happens and try and work out what it is. Sometimes you'll see hot water going on at 3am. This may be needed for a particular reason, but if it is not - you may be able to install a hot water timer to move hot water production to the middle of the day. You may even notice your dishwasher using considerable energy at 8pm every night. Ask yourself if it is possible to move that to the morning - maybe with a timer.
Whist you can save energy by modifying your energy consumption patterns, sometimes it is just not practical. Monitoring is not designed to give you a guilt-trip. It's designed to be a tool to help you make better choices by understanding solar production and energy consumption. On hot days, using air conditioning is a necessity for many people. Cooking in the evenings is unavoidable for most families and using heating in the winter is a basic need.
Related Articles
Fronius WiFi monitoring Setup
Please find our attached our setup guide for the Fronius WiFi monitoring app. Please feel free to call between 9am and 5pm Monday to Friday if you need assistance, alternatively, you can respond to this email with your questions. Fronius - Solarweb ...Fronius Error codes
This list of Fronius Error codes may not be complete. We are adding codes as we learn about them. Error Code Message STATE 101 Grid voltage beyond permitted limits STATE 105 Grid frequency is too high STATE 107 Synchronisation with the public mains ...Sungrow WiFi connection to modem
GI Energy notes You can either guide the client over the phone or share these instructions with the client. Sungrow WiFi re- connection guide If you did not complete the WiFi setup process during the initial setup, or if your WiFi connection has ...Sungrow solar monitoring - Complete setup guide
Sungrow Application setup. Step 1 Prepare by getting your home WiFi network name and password and obtaining the Solar inverter serial number and password. You will find the serial number on the side of your solar inverter. You will know it is the ...ABB inverter - WiFi connection setup
— Connecting ABB inverter to home network Step 1: Go to the Wifi Setting on a mobile device or on a computer and connect to the ABB Network. The access point default password is ‘ABBSOLAR’ for the first 24 hours from the time the inverter is powered ...